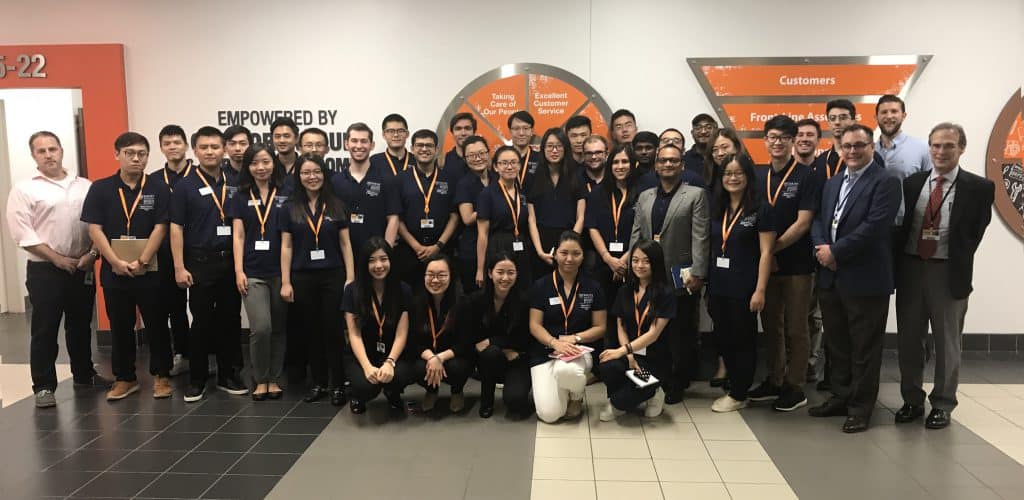
Into the Real World: Visiting Home Depot

Buzz words come and go every year: O2O, blockchain, VR, machine learning, big data, cloud computing, AI and more. However, no matter how fancy they sound, it comes down to the business data scientists utilizing these technologies and correctly collecting and processing data to create real business impact. This is what the Master of Science in Business Analytics program at Goizueta is preparing us for. Therefore, in addition to being equipped with analytical tools and techniques at school, it is equally important for us to get a sense of how data analytics creates business value in the real world.
Luckily, Atlanta is a major hub of businesses, accommodating 16 headquarters of Fortune 500 companies, such as Delta, UPS, Coca-Cola and Home Depot. We had the honor to visit the headquarters of Home Depot. As the world’s largest home improvement retailer with over 2,200 stores across North America, Home Depot showed us how they incorporate data analytics into their business.
During our half-day visit, we met with directors and senior managers from pro merchandising strategy, pricing and assortment, as well as data scientists from BlackLocus, a sub-organization specialized in machine learning solutions. I was delighted to be exposed to how data science and business processes mingle together. For example, from the pro merchandising team, we learned about the opportunities and challenges that e-commerce brings to the traditional brick and mortar business. As a result, we had a glance of how Home Depot has managed to incorporate both approaches to become more competitive. We have also seen how Home Depot captures market data at scale and in return delivers intelligent analytical solutions, which is an approach that is transforming the mindset of the whole organization.
In addition to all this knowledge, I was mostly surprised by the strong correlation between what the data scientists are doing in the field and what we are learning at school. When the pricing team talked about splitting the market by different regions with different demands and implementing an automated pricing solution, it reminded me of the clustering and predicting algorithms in our Machine Learning class with Professor George Easton. When the assortment team showed their reports, I saw the familiar visualization techniques we practiced in our Data Visualization class with Professor Jesse Bockstedt. The funniest part, though, was that when the senior data scientist from BlackLocus said “80 percent of our job is to clean and prepare data,” we burst out laughing, since we have encountered the same fun in various projects.
The trip to Home Depot was our first but not last industry engagement. It was a great complement and extension to our academic training. After learning some techniques and theories in the ivory tower, we were able to see how they are put into practice. We returned to school with reinforced knowledge of why we are doing what we do and tips on making our work more valuable in context. Now, it is the beginning of the spring semester, and I have started on the capstone project. I am very excited to work with VINFactor, a technology startup based in Atlanta, and apply what I have learned in school to help with their business.
