Intro to Business Analytics: How I learned how to learn

If you are reading this, you probably have read the following sentence by McKinsey 10 times already: “By 2018, the United States alone could face a shortage of 140,000 to 190,000 people with deep analytical skills as well as 1.5 million managers and analysts with the know-how to use the analysis of big data to make effective decisions.” It’s 2017, and it seems that a well-loaded job offer is easily in your reach when you are admitted to the master’s in business analytics program, until you start writing python codes and struggle to import the data set for 15 minutes at the very beginning of your Intro to Business Analytics class.
This was what happened to me, and it is just a simple representation of the series of challenges a social science major faces when he transitions to a professional STEM career. The math is hard, the concepts are abstract, and the codes are just annoying snakes tightening around your neck. People coming from STEM backgrounds are slightly relieved, but given data science is such a new field, the knowledge they learned in the past is quickly exhausted. Even for those that are technically savvy, the interpretation and communication part is still a new world. After all, the role of a business data scientist is not just about mining data and creating charts. It’s more about making sense of the data, extracting insights from them, and eventually helping others understand and use the results to make a valuable business impact.
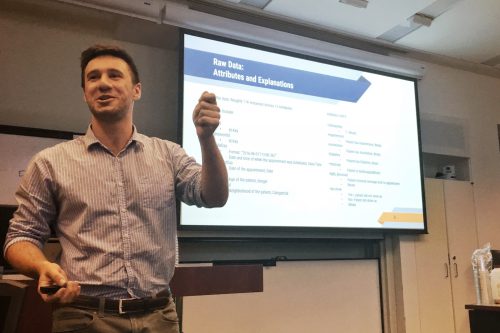
 The cutting-edge nature of this field thus requires a critical ability: self-learning. I believe the most important skill the MS in Business Analytics program has been training me for is to learn how to learn. The most frequent answer Professor Vilma Todri, former data scientist at Google and our professor of the Intro to Business Analytics class, gave us is “just google it.” This is in fact much harder in practice and much more valuable than it sounds. There is a lot of information out there in the language manuals, stack overflow posts and geek blogs, but it takes intelligence and experience to ask the right question to find the most accurate answer in the timeliest way. To put it simply, what we did in the Intro to Business Analytics class is to learn many concepts and algorithms, see how they work in practice, and use them in hands-on projects. The cycles of cleaning data, modeling, debugging, making sense of the results and optimizing performance are mixed with joy, frustration and hysteria. Therefore, it is extremely fortunate for me to have a band of brothers and sisters to discuss strange concepts, fight over different algorithms yet embrace the challenges together. It is even more fortunate for us to have a group of caring faculty and staff, who are always generous and patient in giving guidance, as well as donuts and hot cookies after exams and presentations.
To end this blog with some concrete information about our coursework, we have learned about decision trees, k-NN, regressions, k-means clustering and grid search (“just google it!”). We have used python, R and RapidMiner to do the data mining for data sets whose sizes range from 300 to 800,000 rows. Our final project topics included classifying valuable customers for marketing campaigns, finding out the most significant factor in successful speed-dating matches and predicting whether a class member’s autobiography would be a hit on Amazon. After completing our Intro to Business Analytics class, we are now equipped with essential technical tools, theoretical concepts and practical communication skills to become successful business data scientists. We are excited to further dive into machine learning, big data, data visualization and social network analytics for the rest of the semester.
